
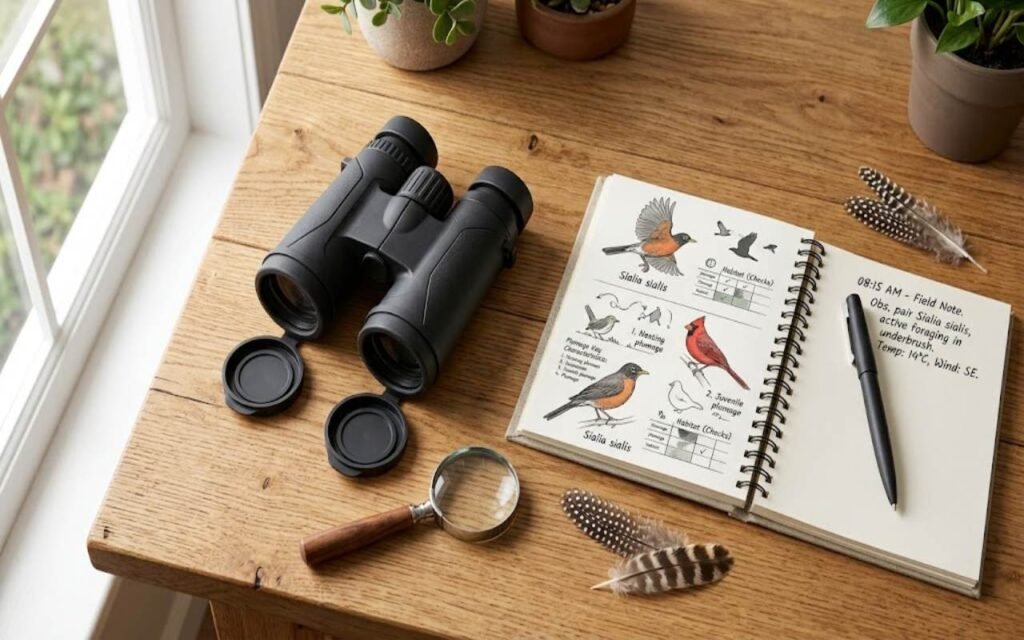
Backyard birding is no longer just a casual pastime for nature lovers. It is now a massive multi-billion dollar economic powerhouse across North America.
Our comprehensive backyard bird watching statistics guide reveals the true scale of this hobby. We compiled the latest industry data to highlight demographic shifts and critical conservation challenges facing our skies today.
📊 Key Takeaways & Executive Summary
- $107.6 billion in total U.S. birding expenditures was recorded in 2022, positioning wildlife watching as one of the largest outdoor recreation economies in North America.
- 96 million Americans, representing 37% of the U.S. population aged 16 and older, participated in birding in 2022, with 91 million watching birds from home.
- 2.9 billion birds have been lost from North American skies since 1970, while 229 species currently carry high or moderate conservation concern ratings.
Consumer Spending and Economic Impact
- $107,588,227,000: Total U.S. birding-related trip and equipment expenditures in 2022 among residents aged 16 and older; includes$ 14.5 billion in trip spending and $93.1 billion in equipment spending. (U.S. Fish and Wildlife Service, 2024)
- $93,097,527,000: Total equipment-related birding expenditure in 2022, representing approximately 87% of all birding spending recorded that year. (U.S. Fish and Wildlife Service, 2024)
- $41,325,828,000: “Other items” equipment expenditure in 2022, equal to 44% of total birding equipment spending; this category covered land, plantings, memberships, publications, and wildlife-observation property. (U.S. Fish and Wildlife Service, 2024)
- $31,000,000,000: Approximate portion of the “other items” category attributable primarily to property used for observing, photographing, or feeding wildlife, including birds. (U.S. Fish and Wildlife Service, 2024)
- $14,490,700,000: Total trip-related spending by U.S. birders in 2022, covering transportation, lodging, food, and associated travel costs. (U.S. Fish and Wildlife Service, 2024)
- $12,582,608,000: 2022 spending on direct wildlife-watching equipment, including bird food, nest boxes, birdhouses, birdbaths, binoculars, cameras, field guides, and maps. (U.S. Fish and Wildlife Service, 2024)
- $3,738 per birder: Average combined trip-related and equipment expenditure in 2022; broken down as$ 339 in trip costs, $182 in wildlife-watching equipment,$ 124 in auxiliary equipment, $2,357 in special equipment, and $737 in other items. (U.S. Fish and Wildlife Service, 2024)
Participation Demographics and Household Penetration
- 96,000,000 people, or 37%: U.S. residents aged 16 and older who qualified as birders in 2022 by closely observing or identifying birds at home or taking a birding trip at least one mile from home. (U.S. Fish and Wildlife Service, 2024)
- 91,000,000 people, or 95% of all birders: Participants who watched birds around the home in 2022; this group represented 35% of the entire U.S. population aged 16 and older. (U.S. Fish and Wildlife Service, 2024)
- 43,000,000 people, or 44% of birders: Participants who traveled at least one mile from home primarily to observe birds in 2022; this group represented 16% of the U.S. population aged 16 and older. (U.S. Fish and Wildlife Service, 2024)
- 67 days per year: Mean number of days spent birding around the home by backyard birders in 2022; away-from-home birders averaged 34 days per year in the same period. (U.S. Fish and Wildlife Service, 2024)
- 49% female, 49% male, and 1% other genders: Gender distribution of around-the-home birders in 2022; away-from-home birders were 48% female, 51% male, and 2% other genders. (U.S. Fish and Wildlife Service, 2024)
Canadian Household Penetration & Domestic Travel
- 26% of Households: The proportion of Canadian households that actively purchase food or shelter for birds on their property (Statistics Canada).
- 37% in Rural Areas: Participation jumps heavily in non-metropolitan Canadian households, compared to 22% within major cities (Statistics Canada).
- 2.8 Million Activities: The number of domestic trips taken by Canadians for wildlife or bird watching in Q2 2022 alone, beating out camping, golfing, and cycling (Statistics Canada).
- 17% of Residents: The bird-watching equipment and travel capital of Canada, located in Victoria, British Columbia, where nearly 1 in 5 households invest in gear (Statistics Canada).
- 352 Sanctuaries: The total number of official nature parks, bird sanctuaries, and conservation areas operating across Canada (Statistics Canada).
Feeding Habits and Food Material Preferences
- 25,000-plus participants annually: Approximate number of Project FeederWatch participants across the United States and Canada each season; approximately half submitted completed checklists. (Cornell Laboratory of Ornithology and Birds Canada, 2021)
- Approximately 180,000 checklists annually: Number of Project FeederWatch checklists collected during the 2019 to 2020 season alone, with submission volume increasing across the program’s history. (Cornell Laboratory of Ornithology and Birds Canada, 2021)
- 34,074,558 observations: Total Project FeederWatch observations submitted from 1988 through 2020; 516,614 observations (1.52%) were flagged for review, and 48,417 (0.14%) received permanent flags after review. (Cornell Laboratory of Ornithology and Birds Canada, 2021)
- 1,200,000 feeder visits over three years: North American observational sample used to assess wild-bird seed and feeder preferences across 10 common food ingredients; black-oil sunflower ranked as a leading preference, while milo ranked among the least preferred materials. (National Audubon Society, 2023)
5 preferred seed types out of 10 tested: Black-oil sunflower, fine sunflower chips, medium sunflower chips, Nyjer, and white proso millet were identified as the strongest overall seed choices in feeder-preference research conducted across North American stations. (National Audubon Society, 2023)
Avian Population Shifts and Conservation Metrics
- 2.9 billion birds lost, equivalent to 29% of 1970 abundance: Estimated net decline in North American breeding-bird abundance from 1970 to the study period; the 95% confidence interval was 2.7 to 3.1 billion birds, or 27% to 30%. (Cornell Lab of Ornithology and collaborating North American research institutions, 2020)
- 229 species: Number of U.S. bird species classified as having high or moderate conservation concern in the 2025 assessment due to low populations, declining trends, or documented threats; this represents approximately one-third of all American bird species. (U.S. North American Bird Conservation Initiative coalition, 2025)
- 112 species: Number of U.S. “Tipping Point” species that had lost more than 50% of their populations during the previous 50 years, requiring targeted intervention to prevent further collapse. (U.S. North American Bird Conservation Initiative coalition, 2025)
- 42 species: Number of “Red-Alert Tipping Point” species identified as carrying perilously low populations combined with steep downward population trends, requiring immediate conservation response. (U.S. North American Bird Conservation Initiative coalition, 2025)
- 43% and 41% declines: Population losses since 1970 recorded for U.S. grassland birds and arid-land birds, respectively; both groups ranked among the fastest-declining habitat-associated bird groups in the 2025 assessment. (U.S. North American Bird Conservation Initiative coalition, including Cornell Lab of Ornithology, 2025)
Global Ecotourism & Commercial Market Trends
- $62.73 Billion: The global valuation of the birdwatching tourism market, projected to scale to $95.22 Billion by 2030 at a stable 6.2% CAGR (Archive Market Research).
- $14.2 Billion: The revenue generated solely by birdwatching tourism within the United States, expected to touch $20.6 Billion by 2030 (Market.us).
- $53 Million: The hyper-localized economic impact generated by a single 6-week spring migration birding festival in Ohio, drawing over 70,000 seasonal visitors (Local Tourism Data).
- $216.8 Million: The global valuation of the outdoor bird feeder market, expected to reach $309.15 Million driven by expanding urban interest in wildlife tracking (TechSci Research).
- 35 to 54 Years Old: The dominant age demographic for commercial birdwatching tourism, representing 42.05% of all specialized eco-travel bookings (Cognitive Market Research).
Economic Impact Comparison: Wildlife Watching vs. Selected Outdoor Recreation Sectors
| Industry Sector | Total U.S. / Global Economic Output | Participation Base | Primary Expenditure Driver |
|---|---|---|---|
| Global Birding Tourism | $62.73 billion (2023 base valuation) | International Eco-travelers | Guided eco-tours, flights, lodging |
| Birding and Wildlife Watching | $107.6 billion (2022) | 96 million participants | Equipment, property, and trip costs |
| Hunting | $101.1 billion (2022) | 15.2 million participants | Equipment, licenses, and trips |
| Freshwater Fishing | $79.3 billion (2022) | 38.6 million participants | Equipment and trip costs |
| Saltwater Fishing | $43.8 billion (2022) | 12.8 million participants | Equipment and charter costs |
| Snow Sports (skiing/snowboarding) | $58.6 billion (2022–23) | 65.4 million participants | Resort fees and equipment |
| Golf | $84.1 billion (2023) | 41.1 million participants | Course fees and equipment |
Sources: U.S. Fish and Wildlife Service National Survey 2022; Archive Market Research 2023; National Ski Areas Association 2023; National Golf Foundation 2023. Figures represent total direct and indirect economic contributions where available.
🐦 Next Steps for Backyard Birders
Monitoring national spending and population trends highlights the massive scale of our hobby, but conservation starts right in your own yard. If you want to put this data into practice by tracking and managing the most prominent species visiting your feeders today, read our complete tutorial on how to identify european starlings.
Sources and Methodology
- U.S. Fish and Wildlife Service: 2022 Birding in the United States: Demographic and Economic Analysis (PDF)
- U.S. Fish and Wildlife Service: National Survey of Fishing, Hunting, and Wildlife-Associated Recreation (PDF)
- State of the Birds: United States Birds and Conservation Report
- U.S. Geological Survey (USGS): North American Breeding Bird Survey Dataset
- Frontiers in Ecology and Evolution: Academic Study on Wild Bird Feeding Habits
- Verified Market Research: Global Birdwatching Tourism Analysis
- Market.us: Comprehensive Birdwatching Optics and Scope Projections
- Statistics Canada: Households and the Environment Survey: Flocking to Their Houses in the Subirds
Methodology Note: All dollar figures are reported in nominal U.S. dollars for the year cited. Participation figures reflect survey respondents aged 16 and older unless otherwise stated. Conservation metrics are drawn from standardized long-term monitoring datasets including the North American Breeding Bird Survey, Christmas Bird Count, and Project FeederWatch, as cited within each primary source document.