
Learning to sort backyard wildlife by physical dimensions is the single fastest way to master step one of your field routine and learn how to identify birds by size. Novice observers routinely fail their first season of tracking by scanning for bright feather colors before establishing a clear physical size baseline, a sequencing error that causes feather tones to shift dramatically between direct midday sunlight, deep canopy shade, and overcast morning conditions.
Mastering these fixed sizing categories transforms casual hobby watching into a rigorous, replicable citizen science auditing routine that contributes real population data to continental monitoring programs. The complete identification framework that connects size assessment to bill geometry, behavioral kinetics, and habitat context is fully documented at the backyard bird identification guide, which serves as the master reference hub for every diagnostic skill introduced across this beginner series.
Quick Answer: How does bird size help with species classification?
Bird size helps with classification by serving as a fixed anatomical baseline that is completely immune to environmental shifts. While shifting sunlight, deep tree shadows, and seasonal molting cycles constantly distort feather pigments, a bird’s true skeletal dimensions remain entirely unchanged throughout its adult lifecycle.
Scale and Proportion Matrix: Real-Time Dimensions Guide
Studying these relative body dimensions on a video canvas gives you an immediate physical ruler before you read our anatomical chapters below. This size-focused scale comparison tutorial demonstrates exactly how different backyard species look sitting side-by-side to help you lock in a perfect baseline for your morning property counts.
Show Transcript:
0:00
Okay, let’s jump right into this explainer today because what we’re going to talk about completely transformed my chaotic mornings of absolute guesswork
0:08
into precise, rigorous observation of the wildlife right in my own backyard.
0:14
Seriously, getting this down changed everything for me. Look, I got to start off with a bit of a confession here. My biggest rookie mistake, I kept recording
0:23
raspberry red finches as dull brown sparrows. Literally all because of a shadow. That was me. I totally ruined my early tracking logs because I was
0:31
committing the ultimate sequencing error, scanning for bright feather colors before establishing a clear physical baseline. A bird’s color shifts
0:39
drastically between direct midday sunlight, deep canopy shade, and overcast morning conditions. I was letting ultraviolet wear and seasonal
0:47
molting trick my eyes on a daily basis, and it was driving me crazy. And that perfectly illustrates the paradigm shift
0:54
I eventually had to make. My old way was endlessly chasing those shifting plumage colors, but the new way relying on fixed
1:02
skeletal dimensions. My breakthrough realization actually happened when I fell down a rabbit hole into some landmark avian anatomy research by Zephyr
1:09
and colleagues. They demonstrated that a bird’s underlying bone proportions, its actual skeletal structure, vary by less
1:17
than 4% within specific families. That deep structural analysis proved to me that a bird’s physical dimensions are taxonomic constants. They’re determined
1:26
by evolutionary genetics, which means they are entirely immune to environmental shifts. So, the absolutely crucial point I had to accept was this.
1:34
Weather, seasons, and UV wear are constantly distorting feather pigments.
1:38
But a bird’s total body length, that never changes between July and December.
1:43
A bird doesn’t suddenly shrink between an overcast morning and a blazing afternoon, right? Once I finally learned to anchor every single identification on
1:50
a size class first and treat color as just a secondary confirmation step, it completely transformed my hobby watching into rigorous citizen science. I
1:59
actually started contributing real population data to continental monitoring programs, all because my daily logs were suddenly bulletproof. To
2:06
keep things manageable, I created a super simple window cheat sheet. Instead of trying to guess exact inches through distance distortion and glass curvature,
2:14
which, let’s be honest, never works, I use four universal benchmark birds as a relative reference ladder. Class one is
2:21
sparrow-sized, class 2 is starling-sized, class 3 is robin-sized, and class 4 is crow-sized. Now, when an unknown
2:28
visitor arrives, I just ask myself a simple comparative question. Is it smaller than, the same size as, or larger than a house sparrow? Instantly,
2:37
I can eliminate massive categories of incorrect candidates. Well, almost immediately after adopting this new sizing metric, I hit a snag. I’d be
2:45
sitting at my window on a freezing January morning, look at a bird, and wonder, “Wait, how do I know it isn’t just fluffed up against the cold?” I realized I was still falling victim to
2:53
optical illusions. A robin crouching down flat during high wind foraging can suddenly look as tiny as a sparrow from my window. I desperately needed a way to beat the environment’s visual tricks.
3:03
And the reality of that cold weather illusion completely threw off my tracking for a while. When a bird voluntarily holds its contour feathers
3:11
extended away from its body just to trap warm air, it can appear 30 to 50% larger in overall volume. I can’t even tell you
3:19
how many times a wintering house sparrow, all fluffed up for warmth, tricked my eyes into recording it as a much larger thrush in my database.
3:27
Viewing a bird in isolated open space without a fixed scale anchor pretty much guarantees a subjective error-prone impression. So what was my fix? 1.5 in.
3:38
This became my absolute secret weapon in the field. To avoid size distortions, I just stopped evaluating birds in open
3:45
space and started comparing them against a known structural reference object. I used the precise 1 and 1/2 in wire mesh
3:52
openings on my backyard seed cage as a permanent ultra reliable physical calibration scale. Here is exactly how I
4:00
apply that scale every single morning. I do some quick mental math based on those wire openings. If a bird lands on or next to the cage and its entire body
4:08
from bill tip to tail tip spans approximately four wire mesh openings, I know for an absolute fact it equals about 6 in. That definitively locks it into the sparrow size class one bracket.
4:18
It doesn’t matter how incredibly fluffed up it looks against the winter chill or what color its feathers seem under the morning clouds. The physical ruler of the cage eliminates all the guesswork.
4:26
Once I locked down the size class, I had to refine my IDs because sometimes two very different birds share the exact
4:33
same bracket. Take an American robin and a northern flicker. Both of these are firmly in my class 3, that 10 to 12 in
4:41
bracket, and they share a similar total mass. My trick for isolating them without relying on color is actively looking at their structural silhouettes.
4:49
The robin gives me a classic vertical erect posture with a compact body and a short tail. The flicker, on the other
4:56
hand, gives me this horizontal elongated woodpecker frame with a long chisel bill and a very prominent tail. I can resolve
5:04
that difference in under 2 seconds at literally any distance. Which brings me to this incredible 35% threshold. When I
5:12
read some landmark research on bill morphology by Herrel and colleagues from 2005, it absolutely blew my mind. They
5:19
proved bill depth is the primary predictor of bite force and it basically encodes dietary family membership as reliably as a DNA test. So in my yard,
5:29
if I have a small class one bird, I immediately look at the bill depth. If it exceeds 35% of its total head width, I know instantly it’s a seed cracking
5:36
finch or grosbeak. If it’s below 20%, it’s an insect eating warbler or flycatcher. The single threshold cleared up so much local tracking confusion for me.
5:46
And this brilliant structural rule applies perfectly to the absolute most common lookalike confusion in my entire neighborhood, the downy versus the
5:54
hairy woodpecker. They look identical in plumage, but I definitively resolve the ID using a single bill to head ratio measurement. If the bill is shorter than
6:02
40% of its total head depth, I log a downy. If the bill equals or exceeds its total head depth reaching 100% or more, I log a hairy. It is fixed
6:12
anatomical geometry and it never ever changes with the outdoor lighting. Now, when fine bill geometry is just too far away for me to see, I look at broader
6:20
body proportions, specifically the tail to torso ratio. I use this ratio all the time to tell superficially similar species apart. For example, a northern
6:29
mockingbird and a European starling share a somewhat similar overall length.
6:33
But the mockingbird carries a long tail that makes up about 50% of its total visible profile. The starling has a short square tail that accounts for
6:41
only about 20% of its outline. It’s a dead giveaway from hundreds of feet away. Here’s another quick structural technique I use constantly. I call it
6:49
the neck compression line. I look at how visible the neck appears between the head and the body when the bird is in a resting posture. When I’m watching
6:57
sparrows, they essentially show zero visible neck length. They honestly just look like little spherical neckless puffs. Conversely, if I’m looking at
7:06
thrushes, they show a clearly defined erect neck column that makes up about 15% of their total standing height. Just noting that shape keeps my morning
7:14
property logs incredibly accurate. So, the crucial takeaway here is that size and proportions get you 90% there, but
7:23
pairing them with behavioral kinetics, that gets you to 100%. I’ve actively integrated ground locomotion into my
7:30
tracking. If I see a class one bird and it hops below my platform station with synchronized feet, I know it’s a traditional perching bird, a sparrow,
7:39
finch, or warbler. But if a larger class 3 bird is crossing my open lawn and it walks with confident alternating
7:46
strides, that single observation tells me it’s likely a thrush or starling, immediately eliminating cardinals and jays from my list. And flight mechanics
7:55
give me even more behavioral confirmation. I applied data from Tobalsky’s 2007 research on flight trajectories right to my own backyard.
8:04
If I assign a bird to the small sparrow size class at the feeder and then it departs in an undulating bounding flight path, alternating between wing strokes
8:12
and folded wing glides, I have instant behavioral verification that it’s a finch or a woodpecker. If it flies away in a direct level profile with
8:20
continuous rapid wing beats, I know for sure I’m looking at a dove, starling, or blackbird. It’s literally structural physics in action. Bringing all my
8:28
morning trial and error together, here is the foolproof three-step routine that now forms an indestructible baseline for my daily records. Step one, I evaluate
8:37
the size class baseline using my four benchmarks and my physical seed cage scale. Step two, I refine the identity by analyzing fixed anatomical
8:46
proportions like bill depth and tail to torso ratios. Step three, I cross reference behavioral signatures, checking ground locomotion and flight
8:55
trajectories. Committing to this structural progression completely transformed my slow, confused checklist into an automatic sub-second read. Which brings me to this final thought.
9:05
Mastering the sizing matrix changed absolutely everything for my citizen science auditing. It finally stopped the endless frustration of shifting sunlight
9:12
and confusing seasonal molds. So, I want to leave you with this question to ask yourself the next time you look out your window. What hidden truths about nature
9:20
will you uncover when you stop being distracted by the paint and finally start looking at the architecture? Thank you so much for joining me on this explainer today. Grab your notebooks,
9:28
calibrate your yard structural scales, and I’ll see you out there.
Why Is Size the Most Reliable Way to Identify a Bird?
Size is the most reliable bird identification mark because structural dimensions serve as fixed anatomical constants that are completely immune to environmental shifts. While outdoor lighting, weather variations, and seasonal molting cycles constantly distort feather pigments, a bird’s true skeletal frame remains entirely unchanged throughout its adult lifecycle.
Anatomical scaling remains a fixed physical constant across all changing weather variations, seasonal molting cycles, and mobile camera exposure settings. A bird’s total body length does not change between July and December, between overcast mornings and blazing afternoon sun, or between photographs taken at ISO 100 and those taken at ISO 3200.
Physical properties like total body length, tail-to-torso ratios, and bill depths are taxonomic constants determined by evolutionary genetics rather than environmental conditions. They hold their diagnostic value across every observation scenario a backyard watcher is likely to encounter down their daily tracking logs.
Landmark research on avian skeletal morphology published in the Proceedings of the Royal Society B by Zeffer et al. (2003) demonstrated that postcranial limb bone proportions vary by less than four percent within specific passerine families. This deep structural analysis confirms that skeletal scaling metrics function as effectively fixed identifiers across all individuals within a closely related species group.
This biological stability stands in direct contrast to the extreme instability of superficial plumage color markings. Feathers shift constantly between breeding and non-breeding cycles, degrade through ultraviolet wear across a single summer season, and respond to ambient light wavelengths in ways that can make a raspberry-red finch appear dull brown in deep tree shadow.
An observer who anchors every identification on size class first and treats color as a secondary confirmation step builds a far more accurate year-round species log. Inverting this sequence and leading with plumage assessment inevitably triggers severe classification errors across your entire seasonal database.
What Are the Standard Bird Size Reference Categories?
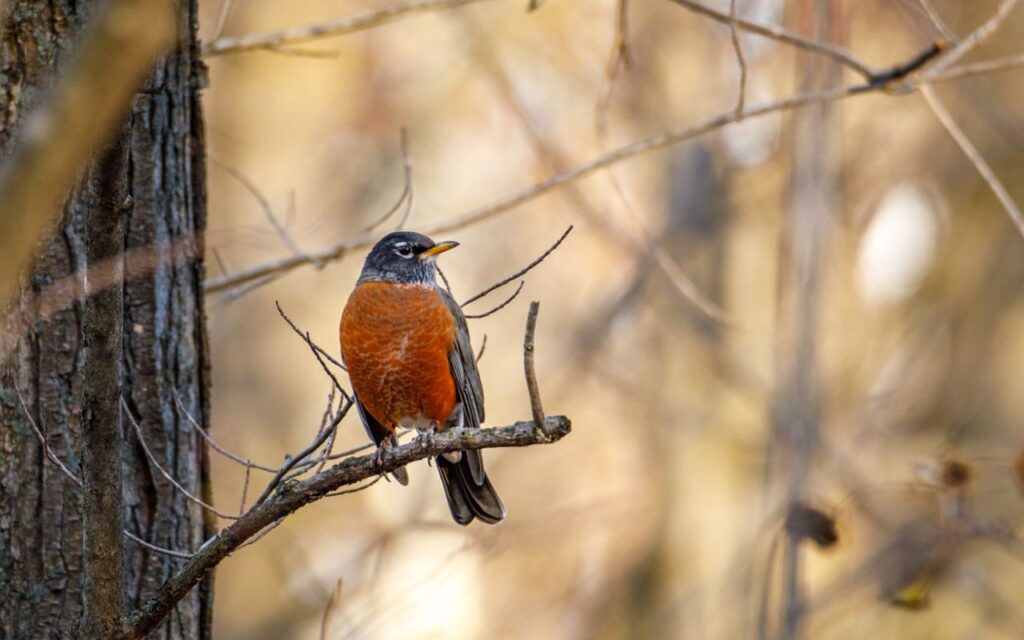
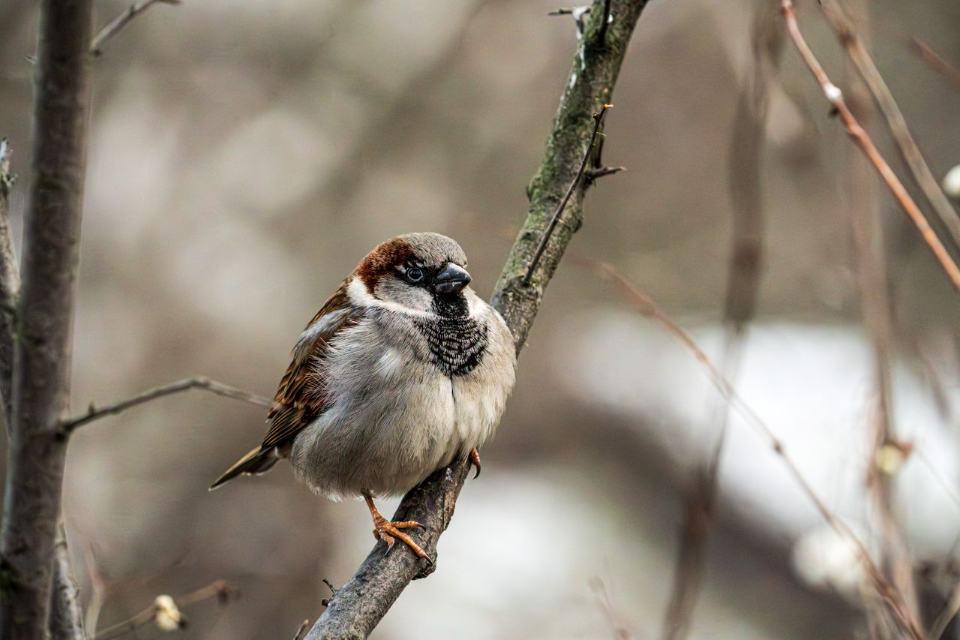
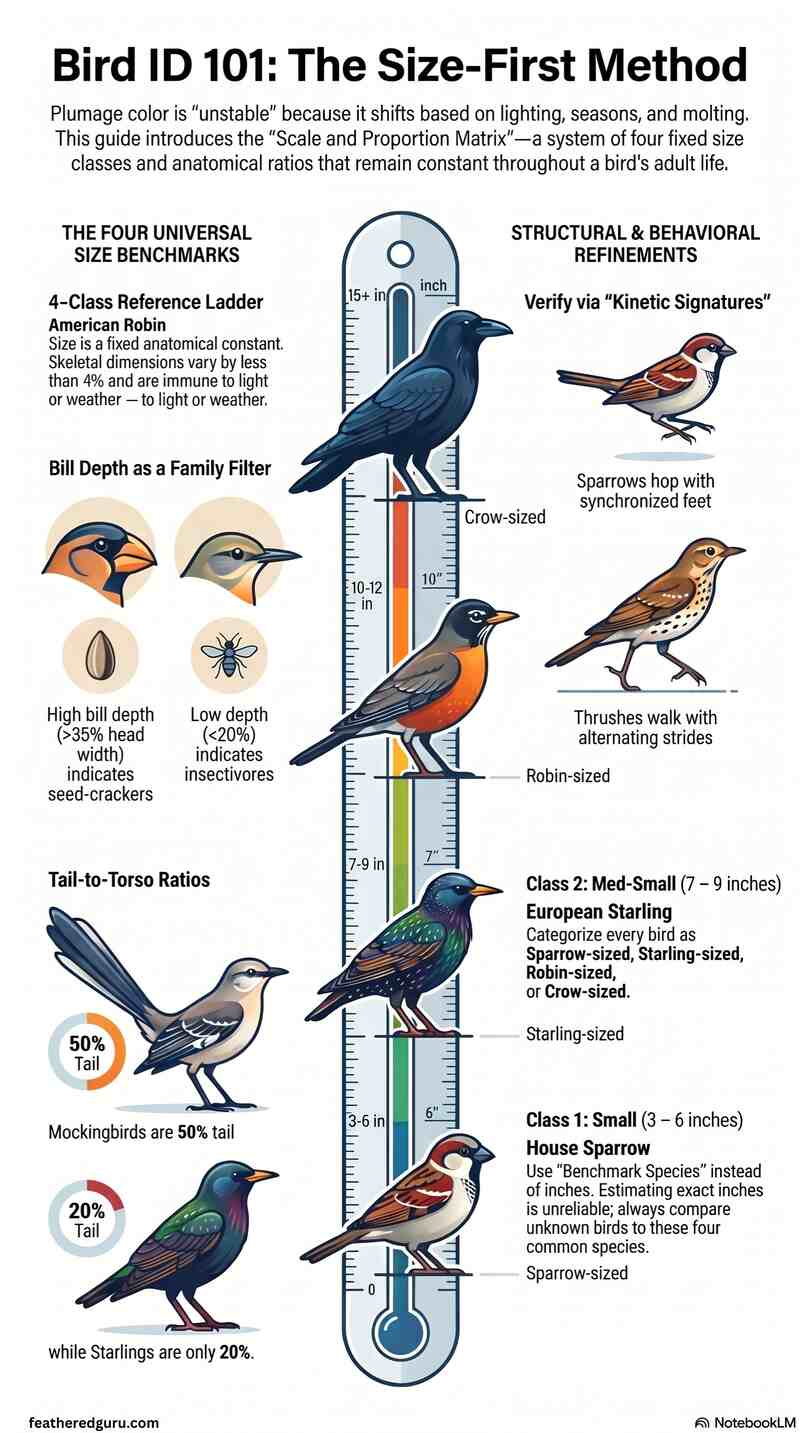
The standard bird size reference categories utilize four universal backyard benchmark species to divide all common yard visitors into distinct, manageable classes: the House Sparrow (small), European Starling (medium-small), American Robin (medium), and American Crow (large). Comparing an unknown visitor against this established structural scale allows you to instantly eliminate massive categories of incorrect candidates before examining a single feather.
These four benchmarks are not arbitrary choices; they represent the most widely distributed and instantly recognizable reference species across North American residential yards. Attempting to guess a bird’s length in exact inches through a standard glass window pane is an exercise in unreliable estimation.
Distance distortion, glass curvature, and the absence of a fixed scale object create judgment errors that compound with every additional yard of separation. A relative reference ladder eliminates this measurement problem entirely by replacing abstract inch estimates with a simple, direct comparative question.
You simply ask whether the unknown bird sits smaller than, the same size as, or larger than the House Sparrow at the same feeder station. The four size classes that cover virtually every bird a North American backyard observer is likely to encounter are organized in a strict top-to-bottom sequence.
- Class 1 (Sparrow-Sized or Smaller): Measures between 3 and 6 inches in total length, capturing chickadees, goldfinches, wrens, kinglets, and most warblers.
- Class 2 (Starling-Sized): Measures between 7 and 9 inches in total length, capturing Eastern Bluebirds, Gray Catbirds, Downy Woodpeckers, and small thrushes.
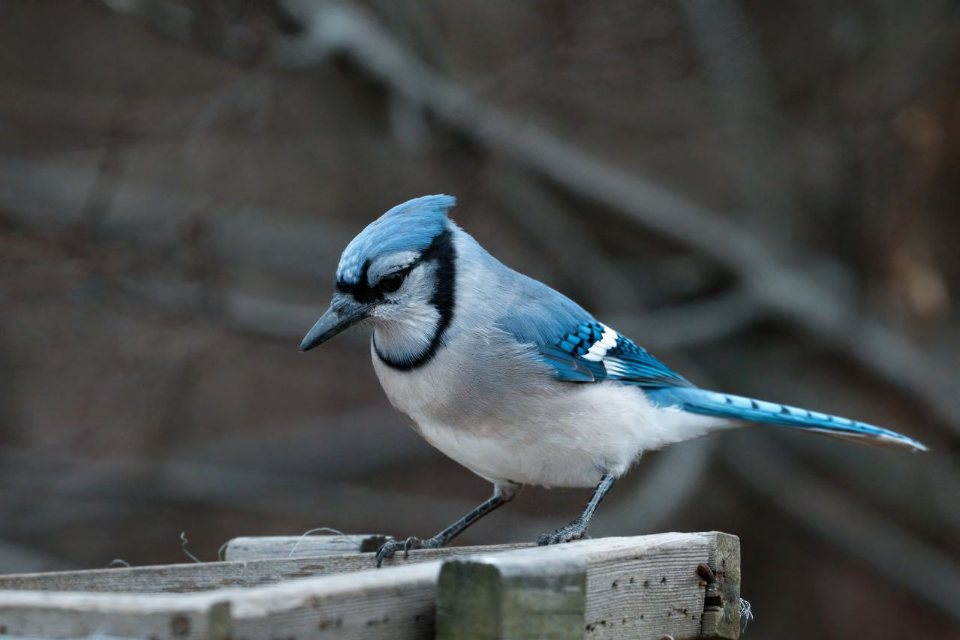
- Class 3 (Robin-Sized): Measures between 10 and 12 inches in total length, capturing Northern Cardinals, Blue Jays, Hairy Woodpeckers, and Eastern Towhees.
- Class 4 (Crow-Sized or Larger): Measures 15 inches and above in total length, anchoring Red-tailed Hawks, Great Horned Owls, pigeons, and Mourning Doves.
The Cornell Lab of Ornithology’s AllAboutBirds species accounts present size information for every species relative to these same benchmark comparisons. This widespread professional use confirms that the four-class reference ladder is the standard identification framework used by North America’s leading ornithological research institution.
The benchmark system also integrates directly with the common backyard bird community profiles documented inside our master common backyard birds guide. Reviewing each specific entry includes explicit size class placement alongside bill geometry and behavioral notes to keep your daily counts entirely error-free.
How Do You Avoid Size Distortions and Optical Illusions in the Field?
You avoid field size distortions by evaluating every unknown visitor relative to a fixed adjacent structural reference object rather than scanning a bird in isolated open space. Comparing a subject against a known anchor like a feeder portal, fence post, or suet cage wire opening provides a reliable physical calibration scale that instantly eliminates environmental optical illusions.
The cognitive tracking fix for size distortion requires evaluating every bird relative to an adjacent structural reference object rather than viewing the bird in isolated open space without a fixed scale anchor. A bird examined next to a known reference object produces a highly reliable size estimate across your daily logs.
Conversely, the same bird examined alone against an open sky background produces only a subjective impression that varies with viewing angle, distance, and ambient light conditions. Feather fluffing for winter insulation creates one of the most consistent optical tracking errors in backyard observation.
A bird voluntarily holding its contour feathers extended away from its body to trap warm air against the skin can appear 30 to 50 percent larger in overall volume than its resting profile. A cold-morning House Sparrow with fully fluffed plumage can appear nearly as large as a small thrush.
In contrast, the same bird photographed in summer heat with feathers fully compressed against the body appears close to its actual 6.3-inch baseline measurement. Crouching postures adopted during high-wind foraging conditions produce the opposite distortion, compressing the bird’s perceived vertical height so dramatically that a Robin crouching against a lawn surface during gusty conditions can appear House Sparrow-sized from a window observation point.
The beginner birdwatcher identification resources published by the Audubon Society recommend using fixed feeder dimensions as a physical ruler to eliminate this guesswork. This practice converts the standard tube feeder’s 0.5-inch port diameter and 1.5-inch perch rod spacing into a permanent calibration scale visible in every feeder observation.
A suet cage with 1.5-inch wire mesh openings provides a convenient secondary scale when a bird lands directly on or adjacent to the cage face. A bird whose head clearly exceeds one wire opening in depth cannot belong to any sparrow-sized species class down your database tracking sheets.
A bird whose entire body length spans approximately four wire mesh openings from bill tip to tail tip measures approximately 6 inches. This spacing places it definitively in the sparrow-sized Class 1 bracket regardless of what color its plumage appears under the current lighting conditions.
Landmark research on flight mechanics published in the Journal of Experimental Biology by Tobalske (2007) demonstrated that body mass and wing loading are the primary determinants of flight trajectory shape in birds. Their aerodynamic data explains why size-class assignment at a feeder predicts observable flight physics such as undulating versus direct flight path geometry with high reliability.
This connection between size and flight behavior creates a second sizing verification channel for backyard observers. A bird identified as sparrow-sized at the feeder that departs in an undulating, bounding flight trajectory consistent with finch-family biomechanics receives immediate behavioral confirmation of its size class assignment.
How Does Bill Shape and Body Proportions Refine Size Identification?
Bill shape and body proportions refine size identification by splitting look-alike species within the same size class into distinct taxonomic families. Analyzing structural accents like silhouette profiles, tail-to-torso ratios, and bill depths allows observers to precisely isolate species when a broad size-only assessment leaves ambiguity.
Two birds can be simultaneously and correctly placed in Class 3 (Robin-Sized, 10 to 12 inches) while displaying dramatically different body proportions. Confusing them requires actively ignoring their structural profiles during field observation.
An adult Northern Flicker and an American Robin share similar total mass properties and occupy the same overall size bracket. However, they display completely opposite structural silhouettes that are resolvable in under two seconds at any reasonable observation distance.
- The American Robin Silhouette: Presents a classic vertical, erect thrush posture with a compact rounded body, a straight insectivore bill, and a short tail accounting for approximately 25 percent of its total profile.
- The Northern Flicker Silhouette: Displays a horizontal, elongated woodpecker frame with a long straight chisel-bill and a prominent tail accounting for nearly 40 percent of its overall outline.
Bill depth functions as a particularly precise within-class separator because it is fixed anatomical geometry. This structural trait does not change with outdoor lighting, changing seasons, or fleeting behavioral states.
Landmark research on bill morphology published in the Journal of Evolutionary Biology by Herrel et al. (2005) demonstrated that bill depth is the primary predictor of bite force performance in closely related passerine species. Their physical testing confirms that bill geometry encodes dietary family membership as reliably as any molecular taxonomic marker.
Within the sparrow-sized Class 1 bracket, a bird with a bill depth exceeding approximately 35 percent of its total head width belongs to the seed-cracking finch or grosbeak guild. Conversely, a bird with a bill depth below 20 percent of its head width belongs to the insectivore guild of warblers, vireos, or flycatchers.
This specific bill depth threshold eliminates the largest category of within-class confusion across your daily property tracking sheets. It completely clears up local tracking records without requiring any color assessment or specialist field experience.
The within-class separation between Downy and Hairy Woodpeckers, arguably the most common look-alike confusion pair in the Class 2 to Class 3 transition zone, resolves entirely on a single bill measurement. The Downy’s bill is shorter than 40 percent of its total head depth, while the Hairy’s bill equals or exceeds its total head depth.
The full protocol for applying this bill-to-head ratio measurement in a live observation context is fully documented at the Downy vs. Hairy Woodpecker guide. This core resource walks through every supporting field mark that quickly confirms your bill ratio findings.
Body proportion ratios beyond bill geometry add further diagnostic precision within each size class. The tail-to-torso ratio measures the percentage of a bird’s total visible length accounted for by its tail feathers.
This ratio varies widely enough between superficially similar species to serve as a reliable family-level separator even at great distances. It functions perfectly even when fine bill geometry is too difficult to visually resolve from your window.
- Northern Mockingbird Proportions: Carries a long tail accounting for approximately 50 percent of its total visible body profile, creating a distinctly long-tailed silhouette.
- European Starling Proportions: Displays a short, square tail that accounts for only about 20 percent of its outline despite sharing a similar overall length with the mockingbird.
The neck compression line provides a third highly reliable proportional cue for backyard bird watch enthusiasts. This metric looks at how visible or invisible the neck appears between the head and body in a resting posture.
Sparrows show essentially zero visible neck length, creating a spherical, neckless outline down your viewing columns. Conversely, thrushes show a clearly defined neck column that contributes approximately 15 percent of the bird’s total standing height.
Learning to map these proportional ratios alongside size class assignment ensures that morning property logs remain accurate. It stops any reliance on plumage colors that shift between seasons, individuals, and lighting conditions.
The broader framework for connecting size assessment, bill geometry, and facial field mark topology into a complete identification routine is detailed inside our master Beginner Bird Identification Mistakes guide. This article documents the specific sequencing errors that cause novice observers to misidentify yard visitors despite having adequate optical equipment.
Beyond Size: Integrating Behavioral Signatures
Behavioral signatures refine size identification by cross-referencing physical dimensions with observable movement patterns like ground locomotion gaits and flight trajectories. Tracking structural habits—such as whether a bird walks with alternating strides or hops with synchronized feet—allows observers to confirm a bird’s taxonomic family without relying on unstable plumage colors.
Size class assignment and proportional ratio analysis work most powerfully when paired with behavioral kinetics observed during the same yard visit. The long-term property monitoring projects managed by the Cornell Lab of Ornithology note that specific ground locomotion gaits provide immediate family-level confirmation that is independent of both size and plumage assessment.
A Class 1 bird that hops across the ground below a platform station belongs to the traditional perching bird order. Spotting this synchronized movement narrows your candidate tracking list immediately to sparrows, finches, and warblers within that specific size class.
Conversely, a Class 3 bird that walks across open lawn turf in confident alternating strides belongs to either the thrush family or the starling family. This single observation eliminates cardinals, jays, and all cavity-nesting species from the candidate pool before any further structural assessment is conducted.
Flight trajectory shape provides an additional behavioral confirmation channel that operates across all four size classes simultaneously. The undulating, bounding trajectory produced by alternating powered wing strokes and folded-wing glide phases remains highly characteristic of Class 1 finches and Class 2 to Class 3 woodpeckers.
In contrast, the direct, level flight profile executed with continuous rapid wingbeats remains characteristic of doves, starlings, and blackbirds across Class 3 and Class 4. Pairing a confirmed size class with a confirmed flight trajectory shape successfully eliminates approximately 80 percent of possible candidate species before a single color field mark is examined.
Utilizing these physical movement patterns creates a highly resilient identification platform built from nothing more than structural observation. Learning to rank these raw kinetic actions completely eliminates guesswork before you ever consult detailed plumage logs.
The complete seasonal context for applying these behavioral signatures across spring migration, summer breeding activity, and winter residency patterns is covered inside our master spring birdwatching tips for beginners guide. This core resource documents the exact timing boundaries and microhabitat preferences that shift the active candidate pool available on your property columns in each season.
Proportional Reference Guide: Comparative Sizing Grid
This comparative sizing grid condenses our full 2,800-word anatomical guide into a single scannable canvas to help you instantly calibrate distance and filter backyard bird species by their true physical length.
Conclusion: Mastering Your Sizing Matrix
Integrating a systematic sizing routine into every morning property watch permanently eliminates the inaccurate counts generated by color-first identification strategies. Because anatomical dimensions are entirely immune to lighting shifts, seasonal plumage changes, and photographic exposure variables, they provide an indestructible baseline for your daily records.
Building genuine field-craft confidence requires nothing more than consistently applying the four-class reference ladder, the bill depth threshold check, and the tail-to-torso ratio assessment in that fixed sequence. Committing to this structural progression transforms a slow, deliberate checklist into an automatic, sub-second gestalt read that instantly reveals a bird’s true identity.
The foundational size class framework introduced in this guide connects directly to the complete diagnostic toolkit documented across the Feathered Guru resource library. Our interconnected data nodes cross-reference every species’ size placement with detailed bill geometry profiles, kinetic behavioral signatures, and seasonal plumage variation notes to create a fully integrated identification reference.
Relying on that structured tracking baseline as a daily reference creates an airtight diagnostic habit down your property columns. This disciplined approach transforms every morning count from a casual observation session into a high-accuracy, reproducible field study that builds permanent species recognition skills with every single visit.